Chastity and the City
A few weeks back I participated in the online conference Demystifying Data Science 2019 and heard of MakeoverMonday.
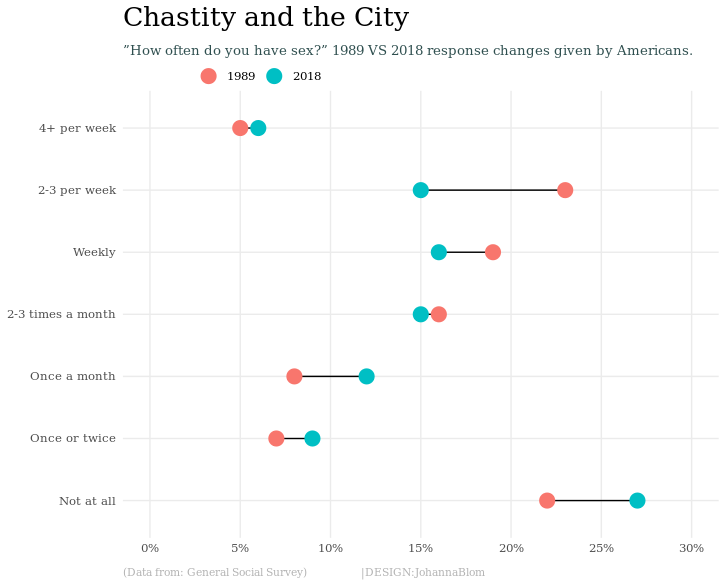
Needless to say, I took advantage of this amazing page to practice making my first R data visualisation (and analyzing American's sexhabits)
According to the, not very representive, data Americans have on average less sex today compared to the 1990s. This is, however, interesting since Eva Illouz (a very cool professor in sociology - check her out!) has been studying sex habits and dating apps. According to Illouz:
- “Tinder, for example, made sex and sex partners as accessible as take-away pizza. It has changed the number of people you can have sex with and has led to an increased “disenchantment” of sex. If sex was previously defined by religion, romance and emotions, then it is to a greater extent something that has only to do with physical pleasure. It creates a dissonance between body and emotion.” Article in Swedish, but video intreview in english.
Illouz has made some really cool research about love - do check her out!
Workflow for the visualization
- Checking and cleaning the data
- Creating a function calculating frequency och organising data again
- Trying to figure out R (Step 2 and 3 took a while.. ^^)
- Trying out the visualisation on friends
- Improving the graph based on friends feedback
I am really happy with my first R try!